Power Duration Curve: Why Cookie-Cutter Plans Plateau
So, you’ve just finished another 16-week training block. You hit every workout, logged the mileage, and did the intervals exactly as prescribed. You’re proud.
Race day comes.
You give it everything. Crash across the finish line. And your time is… almost identical to last year.
But you did everything “right” according to the plan.
Here’s the uncomfortable truth: your training plan probably wasn’t the problem. The problem was that it wasn’t your training plan.
Your plan was designed for the average runner, and you’re not average.
No one is.
In this post, you’ll discover why cookie-cutter training plans have a ceiling, and how data-driven personalisation is helping competitive runners break through plateaus faster.
The Cookie-Cutter Problem
Most marathon training plans, even the famous ones, are built on “best practices”.
These are principles that work for most runners most of the time. We know we need some speed work, some long runs, and some easy work. We know we need to overload progressively and taper before race day.
That’s the general principle that works for everyone.
And it DOES work… to a point.
These plans are based on decades of coaching wisdom and exercise science. They’re not bad. They’re just generic.
Even when you hire a coach, many will take a template plan and adjust it based on your current weekly mileage and your goal race time.
But here’s what they’re missing: your individual physiology.
Imagine two runners. Both run a 3:30 marathon. Runner A has incredible aerobic endurance but a weak lactate threshold. Runner B has a strong threshold but limited top-end VO2max capacity.
A generic plan gives them the same workouts. But Runner A needs more threshold work, while Runner B needs more VO2max intervals.
One plan cannot do justice for both these runners if they want to improve above and beyond other runners.
The result? Both runners will probably improve, but slowly. They’re doing workouts that partially address their needs, mixed with workouts that don’t move the needle for them.
Progress happens, but it’s inefficient.
What if you could know exactly which physiological qualities are holding you back?
Why Power Data Changes Everything
For decades, coaches relied on perceived effort, heart rate, and pace to guide training.
These metrics tell you something, but they’re indirect measures. Heart rate can be affected by sleep, stress, caffeine, and heat. Pace varies with terrain, wind, and fatigue. Perceived effort is subjective and changes day to day.
Enter running power meters: devices that measure your actual mechanical output in watts (similar to cycling power meters).
This is a direct measurement of the work you’re producing. More importantly, power data over time creates your personal power duration curve. This curve is like a fingerprint of your running physiology.
It shows YOUR specific strengths and weaknesses across the entire spectrum of efforts.
Where traditional coaching relies on experience and educated guessing, power data shows you objectively what’s happening in your body. A good coach with experience can make educated guesses about your limiters. Power data removes the guesswork.
This means every training decision can be based on YOUR data, not population averages.
So what exactly is this power duration curve, and why does it matter?
The Power Duration Curve Explained
Your power duration curve is a chart that plots your maximum power output across different time durations.
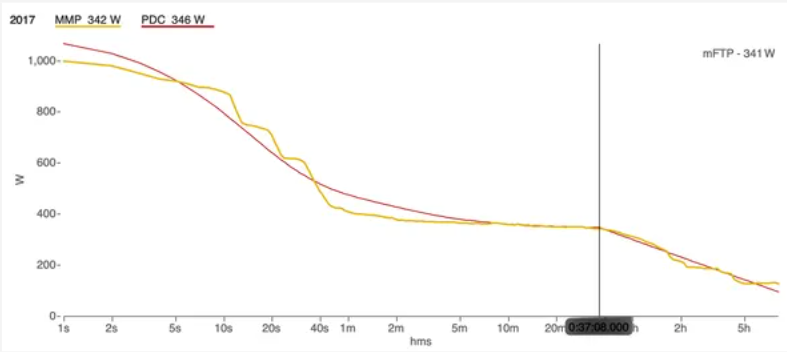
Along the X-axis is duration: from 1 second out to your longest run of 3+ hours. Up the Y-axis is power output in watts. Think of it like a performance profile: it shows how much power you can sustain for any given duration of effort.
Different parts of the curve correspond to different physiological systems:
- Very short durations (5–30 seconds): Neuromuscular power and sprint capacity
- Short durations (1–5 minutes): VO2max / aerobic power
- Medium durations (10–30 minutes): Lactate threshold / functional threshold power
- Long durations (30+ minutes to hours): Aerobic endurance and fat oxidation
Here’s why this matters: the shape of YOUR curve reveals YOUR limiters.
Example Runner A: Strong curve at long durations (great endurance base), but the curve is very flat in the 10–30 minute range. This suggests a weak threshold compared to what they could be capable of.
Example Runner B: Strong curve in the 1–5 minute range (good VO2max), decent threshold, but the curve drops off as it moves into the longer durations. This athlete needs endurance work.
Both runners have a 3:30 marathon time. Both would receive similar generic plans. But their power curves tell completely different stories about what they need.
It shows not only what they need but also what would likely give them a breakthrough performance at their next marathon.
Runner A should focus a training block on lifting that threshold power: tempo runs, threshold intervals, steady-state work at just above race pace.
Runner B should focus on building a bigger aerobic base: more easy volume, long runs, potentially higher intensity at long durations.
Traditional coaching might eventually identify these needs through trial and error over months.
The power duration curve shows you immediately. Even better, as you train, you can see the curve shift and adapt. If you spend 8 weeks working on threshold and your curve lifts in that 10–30 minute zone, you know it worked.
Objective feedback. Not guessing anymore.
But having the data is only half the battle. You need to know how to use it.
Training With Purpose, Not Just Volume
Once you have your curve, every workout has a specific, measurable purpose.
You’re not just “doing threshold work because the plan says so.” You’re doing threshold work because your curve shows that’s your limiter. And you’re tracking whether it’s improving.
This creates a feedback loop: Train → Measure → Analyse → Adjust.
As an example, after an 8-week focused block, you retest your power at that part of the curve. If you set new bests, the training has worked. It might even be worth retesting your threshold power and seeing if all your zones rise, too.
At that point, it’s time to shift focus.
If it hasn’t improved by as much as you’d like, you know you need more time in that zone, or you need to adjust the training stimulus.
This prevents two common mistakes:
- Moving on too early: not giving an adaptation enough time to develop
- Beating a dead horse: continuing to hammer a quality that’s already well-developed while ignoring other limiters
Traditional coaches make these decisions based on feel, experience, and how you report your workouts.
Data-driven coaching makes these decisions based on objective improvement in your physiology.
You also avoid the trap of junk miles: easy runs that are too hard, hard workouts that aren’t hard enough. Every session has a target power zone based on what your curve says you need. No wasted training time.
This is how you get faster, faster.
Why This Gets Results Faster
When your training is precisely matched to YOUR physiology, progression accelerates. You’re not spending 25% of your training on workouts that don’t address your limiters. You’re not guessing whether a training block “worked.” You can see it in the numbers.
Every workout has clear intent, an outcome backed by data.
A runner with great endurance but weak threshold reduces the number of extra long runs they do (they’re already strong and this reduces fatigue) and focuses for 8 weeks on threshold work. Their threshold power increases 8%, and their marathon time drops by 5 minutes. This is not uncommon.
That same runner on a generic plan would have kept building an already-strong endurance base while their threshold languished.
This is the edge that data provides.
It’s not magic. It’s not a shortcut. It’s precision.
You still have to do the work. But now the work is targeted at exactly what you need. And increasingly, this is what competitive runners are discovering.
While others are following the same best-practice plans, data-driven runners are identifying and eliminating their specific limiters.
The gap is widening.
Where This Leaves You
If you’re a competitive marathoner who’s plateaued despite consistent training, the answer isn’t training harder. It’s training smarter: training with precision matched to your individual physiology.
Cookie-cutter plans can only take you so far.
Data-driven, personalised training is how you break through the ceiling. Your power duration curve reveals what generic plans can’t: YOUR specific limiters and YOUR optimal training targets.
This is the approach I use with the runners I coach. I build individualised plans based on power data, not cookie-cutter templates.
You’ve put in the work. You’ve earned the right to train with precision. The data is available.
The question is: are you ready to use it?
If you want to talk through what your own power data might be telling you, book a call and let’s find out.
Nathan is a life-long endurance athlete, and data-driven marathon coach who's helped over 200 runners achieve PBs and 15+ qualify for Boston. He believes in data-driven training, no guesswork, no cookie-cutter generic plans.
Ready to Build Your Breakthrough?
Get personalized marathon coaching that uses data and science to unlock your best performance.
Book Your Free Call